Welcome back to our four-part blog series highlighting the valuable information available on the Bloom Intelligence Dashboard. If you read the first two posts, you already know that our goal at Bloom Intelligence is to provide tools for you to attract and retain an ever-growing loyal customer base. Parts I and II reviewed the first two sections of the dashboard, Footfall Metrics and Customer and Loyalty Metrics. With these key metrics out-of-the-way, let's focus now on customer engagement. Customer engagement guru Paul Greenberg of The 56 Group defines this metric as "the ongoing interaction between company and customer offered by the company, chosen by the customer." In other words, how deep is the connection?
The Bloom Intelligence Dashboard focuses on seven key metrics of customer engagement.
Average Wi-Fi Connections
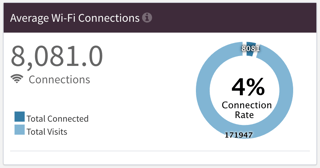 This metric reports the number of connections to Wi-Fi in your retail outlet. It also illustrates the percentage of visitors connecting to the Wi-Fi. This is sometimes referred to as a penetration rate. It is important because it demonstrates the impact of your marketing efforts specifically targeting the call to action of Wi-Fi connection.
Promotions
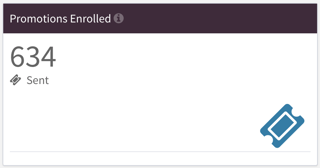 The next two metrics focus on promotional activities. One of the goals of Wi-Fi connection is to capture email addresses. The first measure is a count of visits reviewing various promotions presented to customers. The second is the total number of promotions sent.
New Emails Collected
This feature of the dashboard illustrates the daily activity levels in regards to the ever-important collection of email addresses. Obtaining email addresses is obviously key to customer engagement. If we go back to Greenberg's definition, your retail outlet will offer interaction with your customers. Engagement is a measure of your customer's responses and reactions to those offers.
Custom Block Conversions
These simple little codes allow for tracking the conversion activities for various calls to action by segments of the customer base, dollars spent, and other variables. In a nutshell, they make the data more rich for analysis and improve market segmentation of future campaigns. The dashboard shows the number of custom conversions for your promotions.
Facebook Shares
When engaged customers see a promotion in an email or on Facebook, they will hopefully be inspired to tell their friends, family and colleagues about it. On the dashboard, there is a record of the number of Facebook shares.
Facebook Likes
Another good measure of customer engagement are the number of Facebook likes. As such, this is also included on the dashboard.
Average Rating
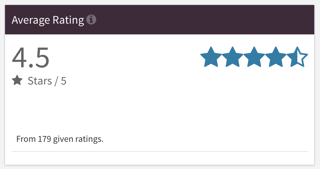 Expect your customer ratings to improve as you build customer engagement. The dashboard keeps track of your average rating on Facebook as well.
Sit back and relax while you wait for the last post of this series. The final section of the dashboard focuses on business metrics and the financial impacts of engaged customers. Business projections backed by data are exciting and we'll be back to tell you about those provided by the dashboard soon!


 This metric reports the number of connections to Wi-Fi in your retail outlet. It also illustrates the percentage of visitors connecting to the Wi-Fi. This is sometimes referred to as a penetration rate. It is important because it demonstrates the impact of your marketing efforts specifically targeting the call to action of Wi-Fi connection.
 The next two metrics focus on promotional activities. One of the goals of Wi-Fi connection is to capture email addresses. The first measure is a count of visits reviewing various promotions presented to customers. The second is the total number of promotions sent.


.svg "group-24 (1)")
